Twitter


Wednesday, December 9, 2015

Equality Commission Monitoring Report No. 25

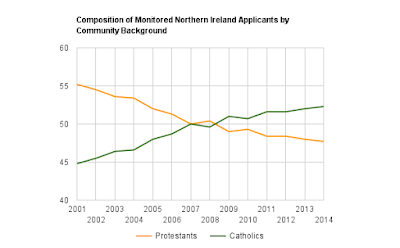
The Equality Commission have published their 25th Monitoring Report. This report provides a breakdown of the composition of the North's workforce in the year 2014. Previous trends show no sign of abating. Parity will be achieved in 2018.

The composition of Catholics in the workforce has increased to 47.4% (+0.4%) in 2014 while the Protestant proportion has decreased to 52.6%.

The reason the trend has continued in 2014 was due to the percentage of appointees from a Catholic community background (51.8%) being greater that those appointed to jobs from a Protestant background (48.2%) and because the Protestant percentage of leavers from the workforce (50.7%) being greater than their Catholic counterparts (49.3%).

Note that the Catholic percentage of applicants to the workforce was 52.3%, somewhat higher than the 51.8% appointed.

It should also be noted that the proportion of Protestants at retirement age is c66%. The 50.7% leaving the workforce each year is much lower than this. 


Saturday, October 31, 2015

Northern Ireland Net Fiscal Balance Report 2011-2012

In any debate on the economics of a United Ireland, Unionists will inevitably contend that the North receives an annual £10bn subvention from Westminster. Their argument is that in a United Ireland the Dublin government would not be able to afford to replace this block grant. Therefore it does not make economic sense to have a United Ireland.

In order to challenge this argument we need to go directly to the source of the argument. In March 2014 the Department of Finance and Learning (DFL) published the Northern Ireland Net Fiscal Balance Report 2011-2012. 

 At first glance the Unionist argument appears to be correct, that Northern Ireland generates around £14 billion in tax revenue and spends approximately £24 billion leaving a deficit of some £10 billion

2011-2012
£'billion
Estimated Total Revenue
14.1
Total Managed Expenditure
23.8
Surplus/(Deficit)
-9.7

Let us delve into the figures. We are told the estimated tax revenue is c£14.1 billion. A breakdown of the relevant taxes is given, but we are not told how much corporation tax which is generated in Northern Ireland but declared in London. This is true for companies which are located in the North with their headquarters in London.

On the expenditure side, what makes up the 'Total Managed Expenditure' figure of £23.8 billion? Total Managed Expenditure is made up of 'Identifiable Managed Expenditure', 'Non Identifiable Managed Expenditure' and 'Accounting Adjustments'.

Non Identifiable Managed Expenditure of £3.3 billion relates to UK wide spending on things like Defence and servicing of debt. Basically it has nothing whatsoever to do with the North of Ireland. I'm not sure exactly what the Accounting Adjustment of £1.1 billion relates to but I do know it relates to an overall UK accounting adjustment. Again nothing to do with the North.

Total Managed Expenditure
£'billion
Identifiable Managed Expenditure
19.4
Non Identifiable Managed Expenditure
3.3
Accounting Adjustments
1.1
Total Managed Expenditure
23.8

So that just leaves us with the 'Identifiable Managed Expenditure' of £19.4 billion. We are told it is made up of Departmental Expenditure Limits (DEL), Annual Managed Expenditure (AME) and Locally Generated Funds.

Locally Generated Funds? Yes, you guessed it. These are funds collected in the North, mainly from regional and local rates. Therefore these funds are not British government funding.

I am not aware of the how much of Identifiable Managed Expenditure is made up of these 'Locally Generated Funds' in 2011-2012 but I do have the figures for 2012-2013. Until I find out the figure for 2011-2012 I will take it that it is the same as the £1.3 billion figure of 2012-2013.

Identifiable Managed Expenditure 2012-2013
£'billion
Departmental Expenditure Limits (DEL)
10.4
Annual Managed Expenditure (AME)
8.1
Locally generated funds (mainly Regional and Local Rates)
1.3
NI Identifiable public expenditure
19.8
   
With the benefit of now knowing the breakdown of the figures we can conclude that the total relevant expenditure in the British government financial year to April 2012 was £18.1 billion and the real budget deficit and block grant was £4 billion.

Relevant Expenditure
£'billion
Total Managed Expenditure
23.8
Non Identifiable Managed Expenditure
-3.3
Accounting Adjustments
-1.1
Locally Generated Funds
-1.3
Relevant Expenditure
18.1

Real Net Fiscal Balance 2011-2012
£'billion
Estimated Total Revenue
14.1
Relevant Expenditure
18.1
Real Deficit
-4.0

So the real figure for the FY2012 was closer to £4 billion rather than the £10 billion that is often stated by Unionists. This is before we adjust for incomplete corporation tax figures.

We do not know the current (FY2015) block grant figure although I have heard several commentators say it is closer to £3 billion. Given the Tory cuts of the last three years a current subvention of £3 billion may not be too far off the mark.

In the recent Irish Unity conference in Belfast, economist Michal Burke states the subvention is just £690 million.

"Outlandish numbers are frequently cited for the so-called subvention from Westminster, which is not included in the resources generated in NI. But the data above shows that there are resources available in NI that make any subvention unnecessary.

Recent ONS data specified the total of taxes and benefits for all households in Britain and in NI. On average households in NI receive £982 more in benefits than they contribute in taxes and charges. As there 703,000 households in NI, the total subvention to households is just £690 million. To be absolutely clear, these benefits are not welfare, but all forms of social protection,  plus the NHS, education, bus passes for the elderly, free school meals, etc., etc.

(The difference between Britain and NI is households in Britain are net contributors to government finances of £152 per annum. This is accounted for by a lower proportion of the population in work and lower paid jobs in NI- a marker of successive failures of British economic policy in NI)".

No matter which figure is correct, let's be clear. The only reason that the North of Ireland requires an annual subvention is because it exists as part of the United Kingdom.

Saturday, May 9, 2015

Nationalist Voter Apathy

After the formation of the gerrymandered, sectarian "Protestant state for Protestant people," the Catholic minority community suffered decades of discrimination, inequality and sectarianism. Essentially second class citizens, many were forced many to emigrate. In spite of this, demographic change started to occur in the 1960s which saw the number and proportion of the Catholic population begin to increase.
                       

Partition was not kind to the Nationalist political parties either who obtained the vast majority of its support from the Catholic minority community. Majority Unionist rule led to gerrymandering and denial of the right to one man one vote. 

As demographics changed and the Catholic population grew so too did the Nationalist vote. Nationalists which once made up a mere 18.9% of the vote, had by the time the Good Friday Agreement was signed in 1998 almost reached parity with Unionists.
                       
From around the year 1998 until 2011 the Nationalist voted seemed to plateau at around 42%. The results of the 2014 local and European elections came as a shock. The combined Sinn Féin and SDLP vote slipped back to 38.5%. The result of the 2015 Westminster election shows this was no once off. The SF/SDLP vote of 38.4% is almost identical to the prior year. So what has happened to Nationalism? Why despite demographic change has the Nationalist vote stalled and gone into decline? Could it be electoral apathy?
The graph below is an estimate of electoral turnout based on election figures and community background figures from the census. It assumes that he vast majority of those brought up in a Catholic community background vote for or are inclined to vote for Nationalist parties and the vast majority of those brought up in a Protestant community background vote for or are inclined to vote for Unionist parties. It also assumes that everybody is on the electoral register.


Nationalist voter apathy was catching up with traditional Unionist voter apathy up until 2009 when parity was reached. Although the proportion of Nationalists voting declined at a greater rate than Unionists, the Nationalist percentage of the vote was holding. This was a sign of further demographic change.
The 2014 European and local elections saw a surge in Unionist turnout. The Nationalist vote continued it's decline and remained well below the Unionist turnout in the 2015 election.

There were two significant events which took place between the 2011 and 2014 elections which could have caused the Unionist turnout to increase well beyond that of Nationalists.
On 4th December 2012, Belfast City Council with it's first ever Nationalist plurality voted to change the policy of flying the Union Flag from City Hall. Instead of the flying of the flag 365 days per year it would only be flown on 17 designated days. The Union Jack which had flown over Belfast City Hall every day for more than a century was taken down.
There was an electoral canvass in 2013. Basically the Electoral Office NI wiped clean the electoral register, an electoral canvass took place in each constituency and a new electoral register was published. The new register contained details of 1,241,079 electors out of an eligible electorate of 1,405,808 based on the 2011 census. The new register contained 88.3% of the eligible population. Could it be that the new register contained a much higher proportion of additional potential Unionist voters than Nationalist voters? The Loyalist reaction to the removal of the Union Jack from Belfast City Hall was bedlam on the streets. Could the overall Unionist reaction have been getting the maximum amount of additional potential voters onto the electoral register?
Clearly Unionists have become more motivated to turnout and vote. But that is only one side of the equation and not something Nationalist can change. What can be changed is the huge increase in apathy among their own base.
In order to resolve this major problem the reasons for increasing apathy must be identified. Then solutions must be formulated.
Possible reasons for Nationalist voter apathy:
  • Despondency. Not much progress has been made since the GFA. The British Government and Unionists have failed to implement outstanding issues of past agreements such as the Irish Language Act. No progress has been made on the A5, the Ulster Canal, Narrow Bridge or an independent University for Derry. Little or no jobs have been created outside of Belfast. No fiscal powers have been secured. Amazingly, both SF and the SDLP have entered into subsequent agreements without first obtaining guarantees on implementing past agreements.
  • The collapse of the Irish economy is likely to have had an effect. Note the large drop in Nationalist turnout between 2007 and 2009. The annual Peace Monitoring Report suggests support for Unity dropped at the height of the recession.
  • Lack of choice. Unionists have the DUP, UUP, TUV, UKIP, PUP, Conservatives etc. Nationalists have two left wing parties with very little separating them bar their view on the past.
  • Lack of Nationalist co-operation. The Unionist pact worked to perfection. In PR elections Unionists will encourage voters to give a preference to all other Unionists on the ballot paper. Past experience suggests SF and SDLP will not do the same.
  • Many practicing Catholics are not enamoured by SF and SDLP views on abortion and same sex marriage.
  • The SDLP are a party lacking individuals with charisma and leadership. They are turning non SF inclined voters off who are either staying at home or voting for Alliance and People Before Profit.
Possible Remedies:
  • A Nationalist Panel should be set up with representatives from all interested parties to research the reasons for increasing  apathy and report back on it's findings with remedies.
  • Granting Irish citizens in the North voting rights in Presidential Elections would energise Nationalists and encourage more political organisation on an All Ireland basis. This should be a key strategic objective.
  • More choice is required. The North is crying out for a centre right All Ireland party. Fianna Faíl who have promised to contest the 2019 assembly elections may offer the best opportunity.
  • Reduce the legal voting age to 16.
  • Learn from the Scottish National Party success in Scotland and replicate where practical.
  • Campaign to get the maximum number of people registered to vote.
  • More focus on getting those living/travelling abroad and those in 3rd level education to use their postal or proxy vote.
  • Both SF and the SDLP need to put aside their narrow political interests and co-operate for the greater good.
  • An Irish Passport Office should be set up in Belfast and/or Derry.

Saturday, February 28, 2015

Schools Census 2014/2015

Today's school children are tomorrows voters. The strong correlation between voting trends and religious affiliation advocates the use of current demographic data to determine future voting patterns.
 
The Schools Census 2014/2015 published by the Department of Education Northern Ireland (DENI) provides a breakdown of the religion of school children in nursery, primary, post primary and special schools in the North of Ireland.
 
As the Schools Census is published annually a trend has emerged of an increasing proportion of Catholics and Others (No Religion/Not Recorded) and a year on year reduction in the proportion of Protestants. Page 27 of this years report shows that these trends are continuing. Catholics now make up 51.3% (+0.2%) of pupils. The Protestant percentage has declined to 38.8% (-0.4%) while the Others have increased to 9.9% (+0.2%).


The figures above are similar to figures in table DC2116NI of the 2011 Census in that they are based on the stated 'Religion'. The 2011 Census also produced table DC2117NI which determines the 'Community Background' of the population. Basically a proportion of 'Others' in table DC2116NI have been allocated to the two main blocks to produce table DC2117NI.

 
This can be replicated in the Schools Census. Primary school children are generally aged between 5 to 11 years and secondary school children are aged between 12 and 18. At the time of the 2011 Census todays 5 to 11 year olds were aged 1 to 7 and todays 12 to 18 year olds were aged 8 to 14.

 
The allocation of 'Others' in table DC2116NI (Religion) to produce table DC2117NI (Community Background) shows the following allocation for todays school children:
  • School children aged 1-7: 20.3% to Catholic. 20.2% to Protestant.
  • School children aged 8-14: 22.0% to Catholic. 23.8% to Protestant.
Using these figures to reallocate 'Others' in the Schools Census to provide a truer reflection of the community background of students, we find that Catholics make up 53.4%, Protestants 40.9% and Others 5.7%

 
Leaving aside the 5.7% 'Others' not identified as belonging to either the Catholic or Protestant community backgrounds, the religious split in the schools is 57% Catholic and 43% Protestant.


So in a week where we find that extreme elements of Unionism are so worried about changing demographics that they are using land funds to prevent Catholics from buying homes, we can determine that the trend towards a 60:40 demographic make up of the North's population shows no sign of abating. If the correlation between voting trends and religious affiliation remains strong, inevitably Nationalism's day will come.

Wednesday, February 25, 2015

Protestant Land for Protestant People


A recent BBC Spotlight programme highlighted land funds controlled by the Orange Order. It is alleged that these land funds are being used by companies linked directly or indirectly to the OO, to purchase land in rural parts of the North in order to keep the land in Protestant hands, or more accurately to keep out of the reach of Catholics.

The alleged "landholding body of the Loyal Orange Institution" is the Ulster Land and Property Company (ULPC) whose motto is "Ulster is being sold, help us buy it." ULPC was formed in 1995 at the height of the Drumcree standoff, to block Catholics buying land.

Of course this type of sectarian skewing of the property market has been going on for decades. In 1920 acres of land was reserved for thousands of Protestants in nearby Cavan and Monaghan who found themselves on the "wrong side" of the new gerrymandered border.

So what have Unionist "leaders" have to say about a practice which effectively seeks to prevent Catholic families from buying homes and in doing so skews the property market. The silence has been deafening. You would have to go back to a row in the Assembly in 2013 where First Minister and leader of the largest Unionist party, Peter Robinson berated Jim Allister of the TUV for selling land to "Republicans", by which of course he meant "Catholics."

"And he chides me for doing business with republicans, but then secretly and, outside of this house, the member as executor of a will, is selling land to republicans in County Fermanagh to benefit his own family"

Imagine for one moment, an organisation made up largely of Catholics such as the GAA (and I am not for one minute comparing the GAA with the Orange Order) purchased land from Catholics in order to ensure it could be sold to other Catholics north or south of the border. Imagine the organisation purchased land from Protestants so it could turn the "colour code" of the land from orange to green. Imagine if they were providing loans and grants to Catholics to ensure the land stayed in the right hands. Imagine the reaction!

There would be calls for a full investigation. There would be calls for the introduction of new legislation. There would be calls for an investigation into how reconciliation funding (including funding provided by the Irish government!) is being used and there would certainly be calls for all future public and reconciliation funding to stop.

It is worth noting that the recent property crash has hit all property companies hard and the Orange Order will not have escaped. In fact it can be said without fear of contradiction that NAMA owns more land north of the border than the Orange Order ever will.

Saturday, January 10, 2015

Labour Force Survey 2013


Following on from the publication of the 24th Fair Employment Monitoring Report by the Equality Commission comes the publication of the Labour Force Survey 2013.

For as long as the correlation between demographic and voting trends remains strong, I will continue to review publications such as these for information provided on demographics, in order to gage possible future voting patterns.

The main difference between the LFS and Monitoring Reports is that the latter does not monitor the self-employed, those on government training schemes, school teachers and those working in private sector concerns with 10 or less employees. While the LFS does look at a wider market spectrum it comes with a health warning in that as a survey the results can be quite volatile due to sampling errors. Also data to determine the community background figures where religion was not provided by those surveyed has not been used in the LFS.

Comparing the figures for the Working Age Population with the LFS 2012 we see that the proportion of Protestants has increased by one percentage point to 45%, the proportion of Catholics remains unchanged at 43%, while the proportion of  those classified as 'other/non-determined decreased by one percentage point to 12%.

The definition of "working age" changed in 2010 to include both males and females between the ages of 16 and 64 (previously it excluded females between ages 59 to 64). Therefore we will look at the figures from 2010 in order to be as consistent as possible.


The Protestant proportion increase of 1% in 2013 makes as much sense as a 2% decrease in both 2011 and 2012. It is clear the volatility of the LFS can cause year on year changes which are contrary to demographic trends. The LFS recognises this volatility stating "it may be due to sampling error and as such year on year changes should be observed with caution and longer term trends should also be considered." The longer term trends are represented in the graph below.


The LFS also gives us a breakdown of the demographics for the Population Aged 16 and Over. We are told "The proportion of Protestants has fallen by eight percentage points between 1990 and 2013, from 56% to 48%, while the proportion of Catholics has increased by three percentage points, from 38% to 41%, over this same period. The proportion of the population classified as ‘other/non-determined’ has almost doubled (from 6% to 11%) over this period".


In the graph above we again can see can see the volatility of the results from year to year. The longer term trend is demonstrated below:


The demographic breakdown of the Population Aged 60+ tells us "the proportion of this age group who identified as Protestant has decreased from 66% in 1990 to 60% in 2013, while the proportion of Catholics has increased, from 30% to 33%, over this same period. Five per cent of those aged 60 and over were classified as ‘other/non-determined’ in 1990; by 2013 this proportion had increased to 8%. We are also told Between 2011 and 2012 the proportion of Protestants fell by six percentage points (from 62% to 56%), the proportion of Catholics increased by eight percentage points (from 29% to 37%), and the proportion of those classified as other/non-determined decreased by two percentage points (from 9% to 7%). Such a large swing in the religious composition of the population of this age group may be due to sampling error and as such year on year changes should be observed with caution and longer term trends should also be considered"


 The breakdown of the Population Aged 16 to 24 tells us "The proportion of Protestants has fallen by seven percentage points between 1990 and 2013, from 49% to 42%, while the proportion of Catholics has increased by one percentage points, from 44% to 45%, over this same period. The proportion of the population classified as ‘other/non-determined’ has almost doubled (from 7% to 13%) over this period".


The data on the 'Working Age Population' shows that the population between the ages 16 to 64 is at or very close to parity. The data on 'Population Aged 16 & Over' and 'Population Aged 60+' telling us there are significantly more Protestants in the older age cohorts. The data on 'Population Aged 16 to 24' shows us that Catholics are in a majority in the younger age cohorts. We can therefore conclude that tipping point for the 'Working Age Population' will be seen in the LFS 2014 and if there is a sampling error in 2014 we will see it in the 2015 report.